Trading Channels and Trendlines
18 May 2018
The ‘Sen’ — the Meridians of Thai Massage
4 March 2020Market function and trending moves
The market is made up of a group of buyers and sellers (traders and algos/computers). Each has their own view on the price they want to buy at and the price they want to sell at.
Buyers and sellers can appear at any price, but there will be particular price areas or levels where buy or sell orders cluster. These areas will be determined by what the market consensus sees as a fair price, by traders’ individual views based on where they bought or sold, and at round numbers, support and resistance levels and so on.
This means that markets cannot go vertically up or down forever — even in the fastest moves prices eventually have to hit one of these clusters of buyers or sellers. If the trend is to continue up or down, we will see a shallow retrace and then the trend will resume. This is the price pattern that the JLo and Igloo are designed to profit from.
1. Bullish: the Saucer
1.1. Introduction
The Saucer is a trade set up that we use to enter a bullish trending move. It provides us with a safe entry on a trend that is already underway.
As a trader, seeing a powerful move up which you’re not positioned for is very frustrating and the temptation is to chase the trade and just jump on board. Having the JLo in our toolbox means that we have a strategy available to us in just such a situation. It gives us clear entries and stops and takes a minimum of several bars to form, so we have time to plan our entry to achieve the best R/R.
In a longer trend, JLos can be used to add to existing positions. By making each entry on the way up risk-free (by closing 50–70% of the trade at +10) you can build up a large position — with no risk attached to it — to ride the trend.

1.2. Market Function
Understanding the market function that drives this pattern will help you trade it profitably.
How the Jlo forms and why it works

Phase 1: price reaches a level where sellers are waiting and sees a sharp reversal
The JLo set up is only valid in trending markets and its formation consists of four phases:
Phase 1: Strong move up that sees a sudden reversal as it hits a layer of sell orders; late entrants to the trend are now sitting on losses
Phase 2: A gentle, curved decline — indecisive action with a negative bias — whose participants are:
-
- Trapped longs/weak holders (sellers) from the up trend closing their positions
- Sellers who expect the reversal to continue
vs. - Buyers wanting to ‘buy the dip’ and position for the next leg up
Phase 3: An up-turn indicated by higher lows (HL) and highs (HH), strong green bars and/or majority of green candles:
-
- Weak holders have now exited the market, so sell orders have been cleared
- Lack of follow through at lows attracts no new sellers
- Buyers gaining confidence as reversal stalls
Phase 4: A break of the range and previous high to form a new bull trend
The total decline (phases 1&2) should be quite shallow and generally no more than 1/3 of the power thrust upwards — use a fib to 38.4% to approximate this measure this if in doubt.
1.3. The setup
Firstly, you have to see a trending move and then a sharp reversal followed by the formation described above.
Entry and stop
Enter the trade as soon as you see some evidence that it’s turning up, usually a combination of higher lows and highs, predominantly green candles and/or larger green candles. Until you see this, this is a sideways move that could just as easily go in either direction, so do not be tempted to enter too early.
Your stop needs to be 1 or 2pts below the low of the sideways range.
At the point you want to enter, there will often still be some indecision in the market, so use this to your advantage to get the best entry for R/R (in other words, resist the temptation to jump in as soon as you see some green).
To take the trade you need to weigh up being sure that you are seeing real evidence of the turn versus waiting too long and allowing prices to pull too far away from the stop level. Timing the long entry is a skill that will come with practice.
These trades either work or they don’t — so don’t get wedded to the trade, or tempted into giving them more room.
Trade management
Take 50 to 70% of the trade off at when you are 10pts in profit and leave the rest to run with stop to entry.
By understanding the market function that drives this set up it should be clear why it is so important to get the trade risk free as soon as possible. Prices may rally, or they may continue downwards after failing to strongly break out of the sideways range or failing to break above the initial reversal point.
Cup and handle
JLos will often see a second, shallower dip and this can be a chance to get into the trade if you missed the first entry. These are more usually known as ‘cup with handle’ and they present an opportunity to get into a trade with a very tight stop.
1.4. Examples of JLos
26th Jan 2018

Close-up, showing entry

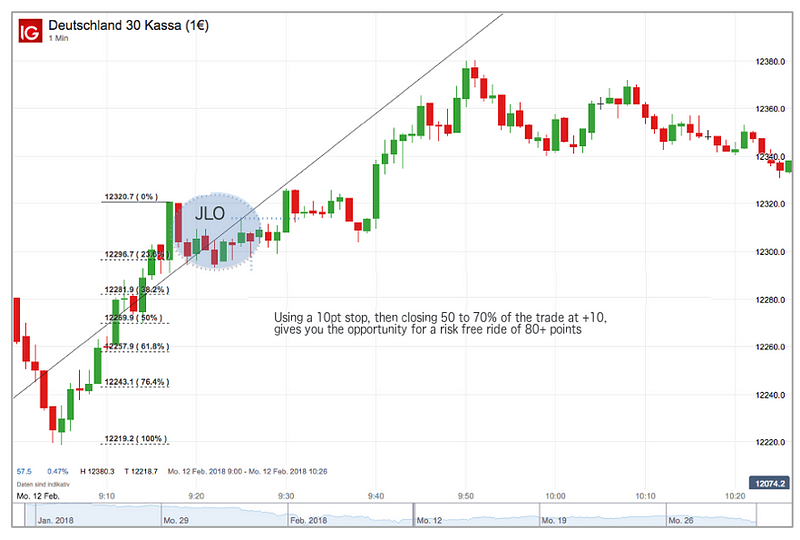
12th Feb 2018

Close-up, showing entry

This is the Dow Jones (Wall Street), and the pattern is not the typical rounded bottom but the principle is the same: sharp move followed by reversal, then indecision and holding HLs before continuing higher.

Time frames
Like all price patterns, these form on all time frames. If we see a possible JLo forming on a higher time frame (1h, 4h or daily), our trade plan will reflect this. During the session we will pay attention to the levels that confirm or invalidate the pattern.
We trade JLo patterns directly on 1m time frame.
1.5. Increasing your success rate — spotting a strong set up
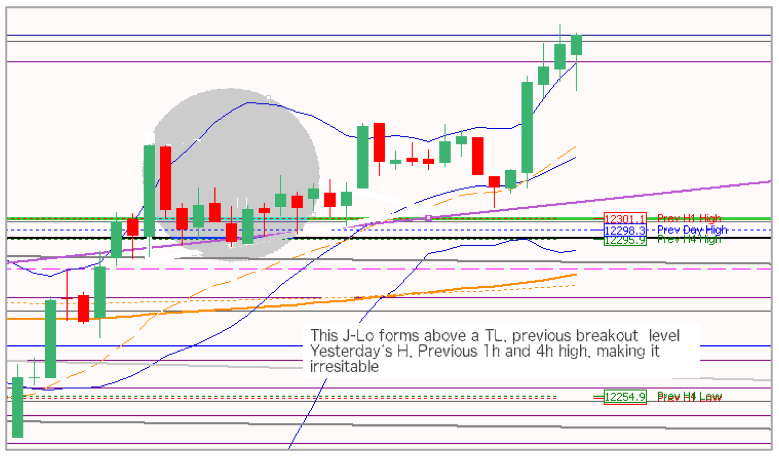
If the shallow, rounding phase of the pattern is supported by a key level, this makes the set up much stronger, i.e. if the initial reversal has occurred after breaking through a KL and the JLo forms above the level.
If there is a level above which prices should go back to, such as previous high or a pivot, this also adds to the probability of the trade working out.

1.6. Summary
Context
· Bullish, trending
· Shallow retrace not greater than 1/3 (use 38.4% fib to approximate) of the trending move
· Period of sideways action
Entry
Evidence of prices turning up:
HH (higher highs), HL (higher lows), big green candles, green candles outnumber reds
Stop Loss
1–2pts below low of the sideways range, or the most recent obvious low depending on Jlo time frame and range
Management
Take 50 to 70% at +10 at and run the rest
Stronger pattern
Formation above a KL
Weak pattern
Formation below a KL
2. Bearish: the Igloo
2.1. Introduction
This is the Jlo in reverse and it has exactly the same purpose: it gives us a safe entry into a trending move — in this case a downward move. It is a great strategy to have in our trading arsenal because it provides an alternative to ‘catching a falling knife’ where you have no obvious stop level and are very likely to become a trapped seller when prices make a sudden, sharp reversal in the trend.

2.2. Market Function
How the Igloo forms and why it works

1. The market hits a level where buy orders are waiting, and sharply reverses
The Igloo set up is only valid in trending markets and its formation consists of four phases:
1. Strong move down that sees a sudden reversal as it hits a layer of buy orders. Late entries to the trend are now sitting on losses
2. A gentle, curve upwards — indecisive action with a positive bias — whose participants are:
a. Trapped short/weak holders (sellers) from the down trend close their positions
b. Buyers who expect the reversal to continue
vs.
c. Sellers wanting to position for the next leg down
3. A down-turn with strong red bars and lower lows and highs:
a. Trapped shorts/weak holders have now exited the market
b. Lack of follow through at highs attracts no new buyers
c. Sellers gaining confidence as reversal stalls
4. A break of the range and previous low to form a new bear trend.
The total retrace (phases 1&2) should be quite shallow and generally no more than 1/3 of the power thrust downwards — use a fib to 38.4% to approximate this measure this if in doubt.
2.3. The setup
Firstly, you have to see a trending move and then a sharp reversal followed by the formation described above.
Entry and stop
Enter the trade as soon as you see some evidence that it’s turning down, usually a combination of lower lows and highs, predominantly red candles and/or larger red candles. Until you see this, this is just a sideways move that could just easily go in either direction, so do not be tempted to enter early.
Your stop needs to be 1 or 2pts above the high of the sideways range.
At the point you want to enter, there will often still be some indecision in the market, so use this to your advantage to get the best entry for R/R (in other words, resist the temptation to jump in as soon as you see some red).
To take the trade you need to weigh up being sure that you are seeing real evidence of the turn versus waiting too long and allowing prices to pull too far away from the stop level. Timing the short entry is a skill that will come with practice.
These trades either work or they don’t — so don’t get wedded to the trade, or tempted into giving them more room.
Trade management
Take 50 to 70% of the trade off at when you are 10pts in profit and leave the rest to run with stop to entry.
By understanding the market function that drives this set up it should be clear why it is so important to get the trade risk free as soon as possible. Prices may re-establish the downtrend or they may continue upwards after failing to strongly breakdown out of the sideways range.
Examples of Igloos
19th Feb 2018

Close up, showing trade entry

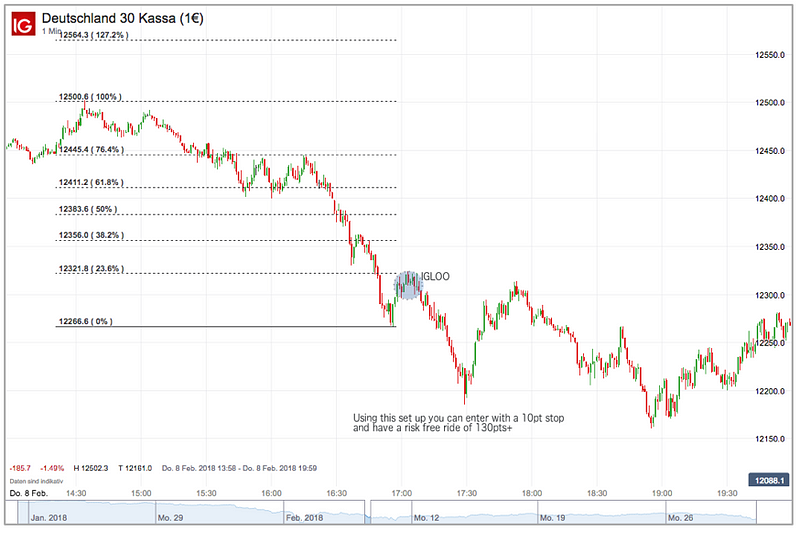
8th Feb 2018

Close up, showing allowances made for the 5-day ATR of 274

Strong setup and weak set ups
If the shallow, rounding over phase of the pattern is into a key resistance level, this makes the set up much stronger.
If there is a level below which prices should revisit, such as previous low or a pivot, this also adds to the probability of the trade working.
Time frames
Like all price patterns, these form on all time frames. If we see a possible Igloo forming on a higher time frame (1h, 4h or daily), our trade plan will reflect this. During the session we will pay attention to the levels that confirm or invalidate the pattern.
We trade Igloos directly on 1m time frame.
2.4. Summary
Context
· Bearish, trending
· Shallow retrace not greater than 1/3 (use 38.4% fib to approximate) of the trending move
· Period of sideways action
Entry
Evidence of prices turning down:
LH (lower highs), LL (lower lows), big red candles, reds outnumber greens
Stop Loss
1–2pts above the high of the sideways range, or above the recent obvious high, depending on the structure and time frame of the igloo
Management
Take 50 to 70% at +10 at and run the rest
Stronger pattern
Formation below a KL
Weak pattern
Formation above a KL


