Trading Channels and Trendlines
18 May 2018
Fading Price Moves
Introduction
The Fade trade is a trade setup I discovered by constantly being on the wrong side of the trade using conventional trading wisdom.
How many times have you jumped on a break out from a range, only for the price to retrace, stop you out, and then rocket?
Or you have sat in a break out trade which has got you into a quick early profit, but then, as profit ticks up, excitement and greed kicks in while you run the trade hoping to hit a lofty arbitrary target.
Then all of a sudden, there is a 20pt drop. You were in 50pts profit over a period of 1h, and now in one min, price has dropped 20pts and you are down to 30pts profit. Greed and hope keeps you in the trade because you think it will continue on up after this retrace and hit your target.
What then happens is PA is back to your entry price in a matter of minutes, and the 50pts you spent all morning collecting as gone in minutes, and instead coming out at entry, hope keeps you in the trade even longer, and by the end of it, you are stopped out at -20, probably 10pts lower than your original stop.
You never know where break out a move is going to end at point of entry. It could go 10pts, or 100pts.
The only thing you know for sure is the market has two states, ranging (consolidating, range compression) and trending (range expansion). And that one state will lead to the other.
A ranging market will eventually break out to a new price norm, and trend will eventually come to an end to either reverse, or retrace and consolidate again.
The Fade trade capitalizes on that end of the move. Instead of jumping on a range breakout, and hoping that it develops into a profitable trend, let the move happen, and jump on the change in direction at the end of the move.
Fading a move means tacking a counter trend position hoping the price will retrace or better still reverse.
We know with a 100% certainty that a move cannot continue going vertical forever. So taking the opposite side of the trade is a guaranteed winner. The skill comes from timing the counter entry and catching the turn, allowing a tight stop for a potential big move in the case of a reversal
Market Function
In order to understand how and why this setup works, it is important to understand market function.
The market is made up of a group of buyers, and sellers. Each has their own view on which price they want to buy at and which price they want to sell at.
Buyers and sellers can appear at any price, but there will be particular price areas where buyers or sellers cluster.
These areas are possibly at where market consensus feels is a fair price, at round numbers, support resistance levels, traders individual views based on where they bought or sold.
Whatever the reason, at particular price areas, the cluster of market participants will be greater than others. At the current price, if there are more buyers than sellers, the price will move up until it reaches and area where there are more sellers than buyers. Price will range between these participants (consolidation) until eventually one side is exhausted. Price will then change rapidly (breakout) through the low participant areas into the next congested cluster of buyers and sellers.
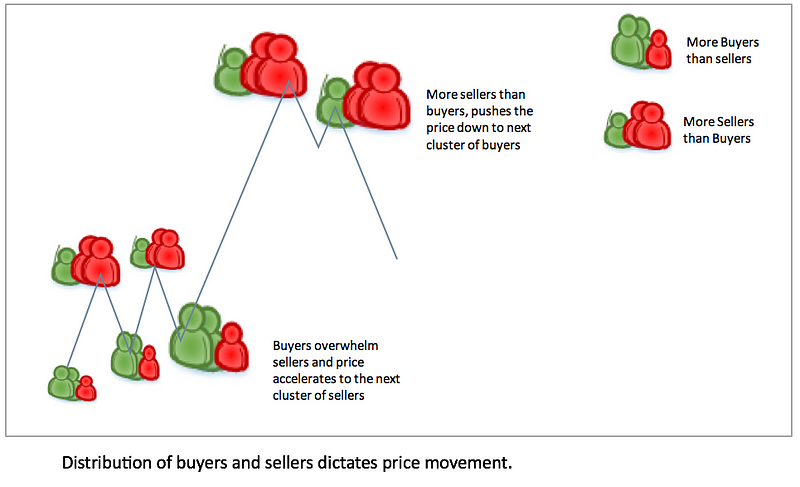
Breakouts from consolidation areas, typically accelerate to the next area as participants from the losing side scramble to cover their positions and even possibly join the other side, exaggerating the imbalance of buyers and sellers.
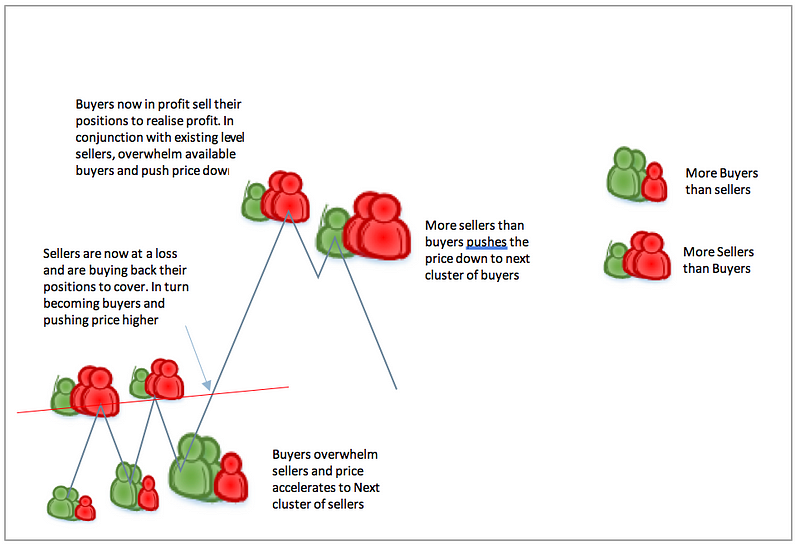
Buyers now in profit sell their positions to realise profit. In conjunction with existing level sellers, overwhelm available buyers and push price down
The important part to understand for the fade trade is, what causes the trend to stop. As the prices continues up, more and more buyers jump on hoping to catch the move with the momentum. The price will eventually and suddenly slam into a wall off patient sellers waiting above.
At or above this area is also typically where we will find a big layer of stops belonging to the traders who got short at the resistance level at the last visit to this price area.
As the price rises, into the layer of stops, a flurry of buy orders are triggered, rapidly accelerating the price eventually exhausting the available buyers. The price will stop dead because there are no more buyers to take it higher.
This is where the sellers take control and price start to reverse. Now all the buyers that bought at the top will start to panic and start selling their positions, adding to the existing selling pressure. On the way up, most of the buyers would have been filled and cleared out of the way so on the way down, there are none to halt the sellers causing a quick drop in price over a few minutes. This is where we are capitalizing with the fade trade.
Identify a good resistance area where there is likely to be a big layer of sellers, and as soon as we see some weakness in the powerful up move, jump in short with a tight stop above the high and catch the quicker move down with the known tight stop.
If you think back to your own trading, you will have experienced this many times if you were lucky enough to be riding a trend. The price accelerates in your favor suddenly, then just as quickly whips round. If you are lucky, you will cover quickly at profit, joining the other side helping the price to reverse.
The Setup
The actual setup its self is very simple. Wait for a trending move, identify the acceleration towards the end of the move on the 1m chart. Wait for the bar to close. As soon as the next bar changes colour, take the counter trade with a tight stop just above the new pivot made by the previous bar.
Lets look at a few examples

In this first example, you can see the trending move down shown by the red line. Price trends down from approx. 650 to 590. A 60 pt move straight down.
You can see from around 640 the move starts to accelerate and then spikes down around 610 (shown by the black arrow) to 590. If you look at the relationship between price and the 12ema (blue moving average line), you will see it has an extended move away from the 12ema. Another short term indicator of a market imbalance.
You can see at the end of the move, the bar closes red, at its low. The next bar opens green, at this point you would get long at the green arrow with a stop just below the low (no more than 6pts).
In this case, the trade resulted in a 50pt reaction in around 15mins.
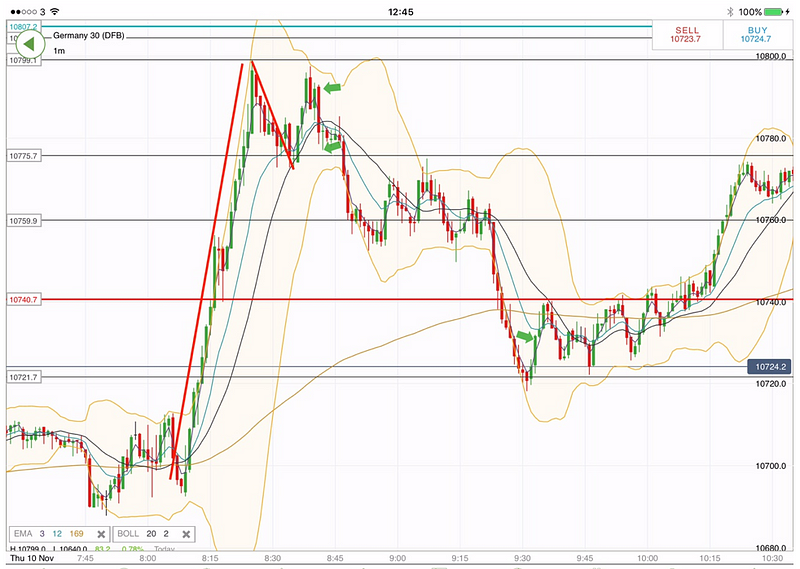
In this example, again the red line shows the trending move up of around 100pts. The acceleration spike at the end starts from around 775 to 799. The spike bar closes and the next bar turns red. The short entry would be around 795 with a stop just over 800. Result, a quick 20pt reaction followed by a deeper sell off taking little to no heat on the trade.

Same here. 100pt trending move, with a spike at the end of the move (see black arrows, and 12ema). Get long as soon as the next bar turns green, resulting in a 100pt reversal with no heat, and a 6pt stop.

This example shows another side to this trade. You can rinse and repeat on every spike down.
The first move is from 510 to 462. The last bar closes red a fair extension away from the 12ema. The next bar opens lower but immediately turns green. You could get long there and scalp 10pts or come out at entry when the trade continues down and makes a second spike lower. At this point, you go again and this time, you would catch a 40pt move.
The greatest part of the fade trade is, if you get stopped out, you know it will eventually have to retrace, so you just wait and go again. On the second of third try, you will get the retrace, and the deeper the move down, the bigger the eventual bounce. You just hold to trade longer until you have covered previous loss or got back to break even.
Getting the best entry
The important thing with the fade trade is not to rush into the entry. First of all, you need to let the bar close and cement a new low so you know where your stop is.
You then need to see some signs of a reversal. A few pips in the opposite direction so you know there is the possibility of a bounce, and then comes the timing.
Keep in mind your stop needs to be 2–3 pips below to low, and your stop should be around 6–8pts maximum.
With that in mind, wait for a couple of points retrace or a pause before entering and make sure that when you press the button, your stop is going to be in a sensible place.
It is very rare to get into a trade that doesn’t back and forth a few pts before continuing. Use this fact to get the best entry.
If you miss the entry, either wait for a pull back to make a new higher low/lower high and try again (see retrace entry)
Wicks

If the impulse bar closes with a wick, you can use the wick as your indication that the trend is turning to enter the trade, but again, make sure your entry would put your stop below the low of the wick. If it doesn’t, wait a few mins to try and get a better entry during a retrace into the wick. If it doesn’t, let the trade go as a late entry will change the RR.
Retrace Entry — Higher low/Lower High
The retrace entry is an alternative entry to the fade trade if you miss the initial entry, or you want that extra confirmation that the trending move has finished before you enter. It can sometimes need a slightly larger stop but works just as well.
Use this entry method if you aren’t confident fading the impulse bar which can be frantic.

In this example, a new high was made at the black arrow, but price fell away too quickly to get a fade entry. The Wick was too large to get short with a tight stop.
The alternative entry is to wait for a 10–15pt reaction to occur from the high, then when price starts to re retrace back to the high, get short on any weakness.
This could be another fade, slightly lower than the high (5–6pts) as seen in this example above. The blue arrow shows the lower high, and the green the entry with a stop just above the blue arrow.
Failed Continuation
This is the final variation of the fade trade and is similar to the retrace entry.
Similarly, you wait for the high to form and get a 10–15pt reaction, you are the waiting for the retrace into the high, but in this case, the previous high is broken for 3–4pts and price immediately falls back. The continuation break out has failed. Enter price drops back below the previous high with a stop just above the new high.

In this example, the black arrow shows the high formed, followed by the reaction. Price then rallys up to the blue arrow breaking the previous high by only a couple of points before falling back below the previous high.
Enter at the green arrow with a stop just above the new high.
These two variants generally work better for fading highs, whereas the original setup tends to work better fading short moves. That’s because reactions to down trends tend to happen quicker than reactions to up move which take a bit longer to reverse.
Trade Management
There are two options for to manage the trade once entered.
The 80/20
This is my favored method. The reaction to the fade generally happens very quickly initially, before retracing back towards entry and then potentially continuing on for a bigger move.
With this in mind, I tend to take 80% of profits fairly quickly. Aiming for around 10pts, but generally happy to take 5+. I would generally take the 80% as soon as I see some slowdown in the first reaction.
This allows me to make the trade risk free for the longer run. Having taken 80% at +10, even if I am stopped out at -10 for the remaining 20%, I still finish up in profit over all.
With this method, the fade trade has a success rate of over 90%. It is very rare for price to go against you immediately as you enter. If that happens, it is generally because you go the entry wrong.
Fixed stop, fixed target
With this setup, it is very easy to catch the high or the low of the day, which means the potential reward can be many multiples of risk.
With that in mind, rather than the conservative approach above, a trader could enter with a fixed 10pt stop and leave the trade to run for a fib target (30–50% retrace) or being stopped.
It is down to the individual trader to do the testing on this but the RR and high hit rate on this setup means the longer term potential is significant.
Increasing the success rate
If you are watching the 1m chart, you will see these setups multiple times a day. However it doesn’t make sense to trade every setup you see. While you may see a reaction, they are likely to be short lived, offering only a quick scalp opportunity.
Before entering the trade, you need to consider the bigger picture and only take setups with potential for bigger reward.
There are a number of things you can do to ensure the reward potential is maximized.
Days High and low
Only taking the fade trade if the market makes a new high or a new low for the day is a great strategy. New pivots are always followed by a retrace or a reversal. Markets do not keep climbing vertically nonstop. By only trading at highs and lows, of the day, you increase your chance of catching a major reversal. Trading in the intraday range, you are more likely to catch a short retrace.
Trade Extremes
Similar to above, waiting for the market to make an extreme move before trading increases the chance of a reaction and also the size of the reaction. After an extreme move, the market needs to retrace and re balance.
When looking to fade a move, evaluate the length of the move from starting point to get an idea of how much potential is left in the wave.
As a starter for 10, while ATR is below 100, 60–70pts seems to be a good minimum wave length before considering a fade. When ATR is able a 100, then 100pts is good number to start looking for fades.
Fade Breakouts
Most breakouts are a result in stops going off and therefore a quick flurry of activity. The breakout will generally clear all the orders in the book around that level. This is a good time to fade the breakout while traders are regrouping and replacing orders. This is especially good if the break out creates a new high or low for the day.
Breaks of Key Levels
Identify key levels on the 15m or 1h chart that have been tested multiple times, but are still a reasonable distance away from the current price. (50+pts away)
These levels are bound to have clustered stops and profit orders around them.
When a major level is broken by a big move that originated much further away, these are the highest probability fade setups.

For example, of 10400 was major support and current price was say 10480. If something happened to cause price to drop straight down from 480 and break 400, that would be a great fade opportunity. The heavy selling volume followed by the triggered stops would temporarily flush the market causing an inefficiency. The perfect time to fade.
Generally key level breaks only stick if the break comes from nearby.
This particular setup has the highest success rate and reward potential of all fade setups. If a trader had the patient to wait for only this setup, there would be no need to trade anything else.
Fade News
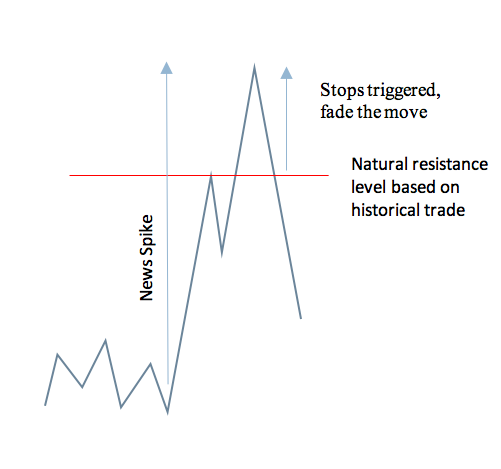
Big moves caused by unexpected news are great to fade. For example, NFP report, EIA Crude oil report, geo political news. When traders are caught unware, panic causes extreme moves and in efficiency in a market. These move almost always retrace back to origin after a period of time as the market rebalances to the longer term view.
These moves are great fade opportunities. The best of these generally happen in 2 quick waves. The initial wave spikes to the strongest nearby support or resistance level which causes a quick retrace. But above or below this S/R level, we have historical stops. If the news move induces enough volume to take out the stops and cause a second surge in price, fading this second surge is highly rewarding. This is the strategy I have been using to trade NFP with great success for a couple of years (only if there is a big hit or miss in numbers)
Further reading
Below are a collection of articles that offer great explanation of market function. Understanding how the market works and what drives the moves, will help a trader understand how to profit from the situations as they arise.
Please read all these articles
http://www.tradeciety.com/the-order-clustering-effect-around-round-numbers/
http://www.tradeciety.com/supply-and-demand-trading-strategy/

