
Fading Price Moves
23 March 2018
Continuation patterns in trending moves
11 June 2018Trading Channels and Trendlines
Why do we draw these lines on our charts?
First of all, we all know that price moves in clear waves. The easiest way to trade with the lowest risk is to spot that change of direction and put a setup around it.
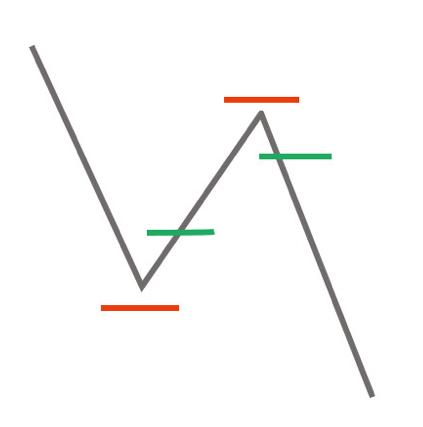
You can all trade price action shown in the picture below: watch a clear wave, and as soon as it turns, stick an entry in counter trend, with a stop just above the high/below the low.
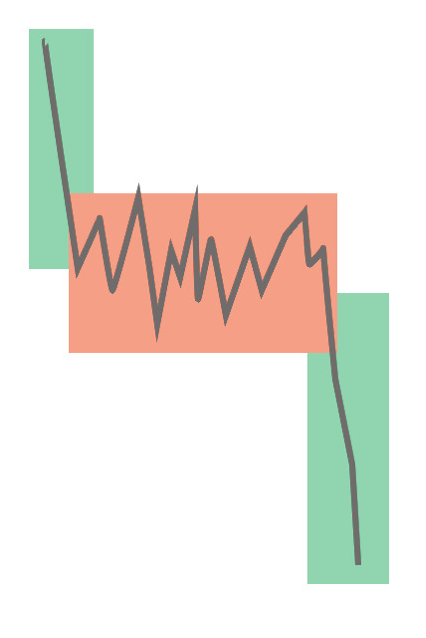
Thing is, we rarely see such clean PA. Normally it looks a bit more like this: you have a clear trending move (highlighted green) followed by consolidation (in red), then another trending move.
Now when you are in the red zone, it’s very tricky to spot the turns. But what if I do this?
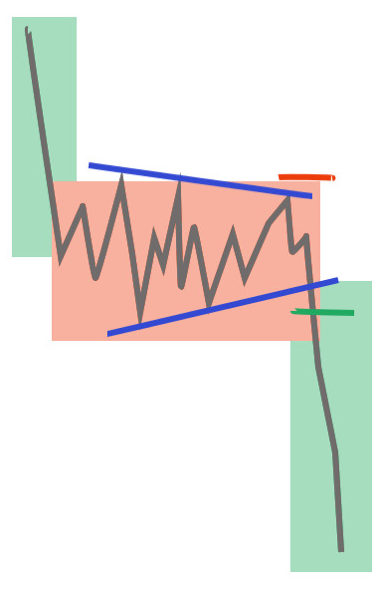
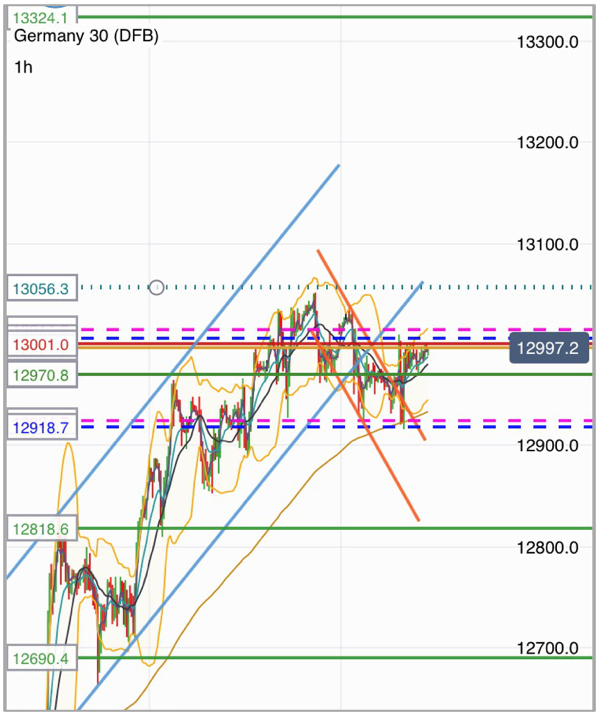
Consolidation is just a wave on a different time frame — look at this 1h chart:
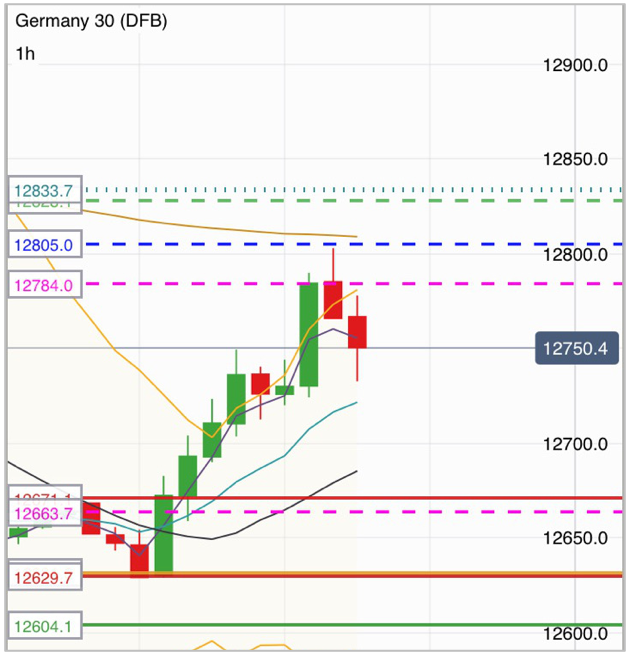
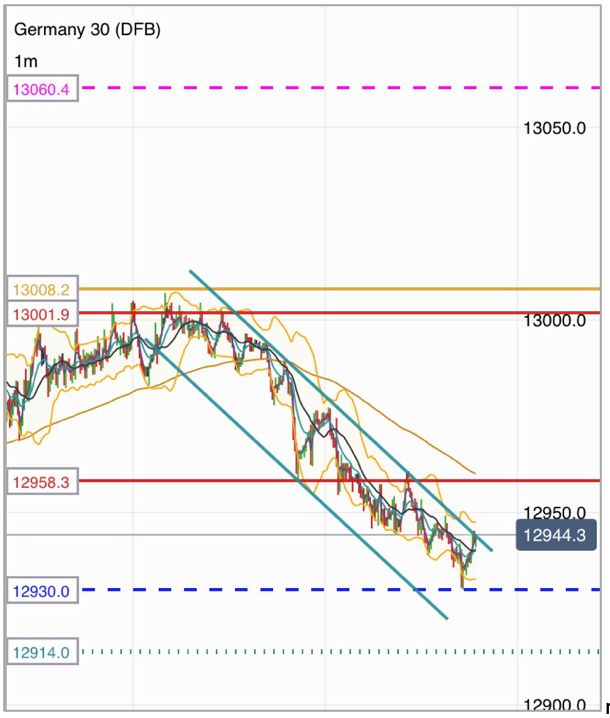
It’s very easy to see the clear wave and the turn on the 1h — but all day, we sat and watched this:
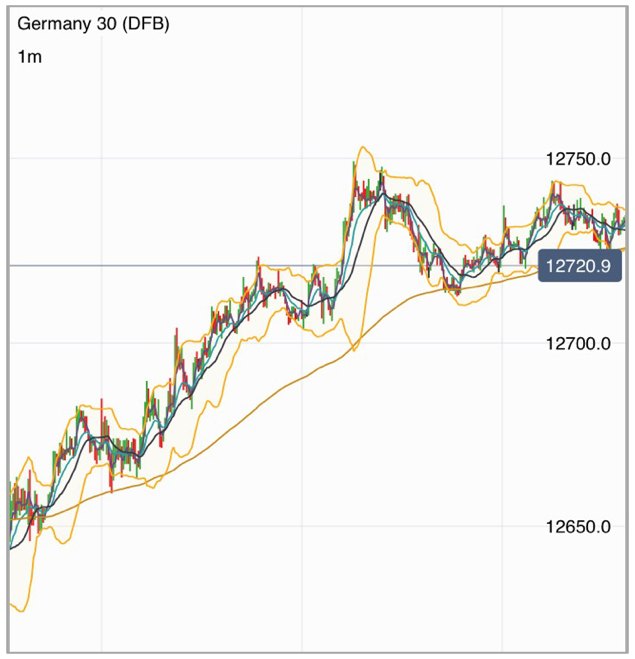
Very hard to spot what’s actually playing out, but when you throw the channel lines on, then you spot it and all of a sudden, everything is very clear. With the lines on the chart, we have a context for the m1 PA — and it makes sense.
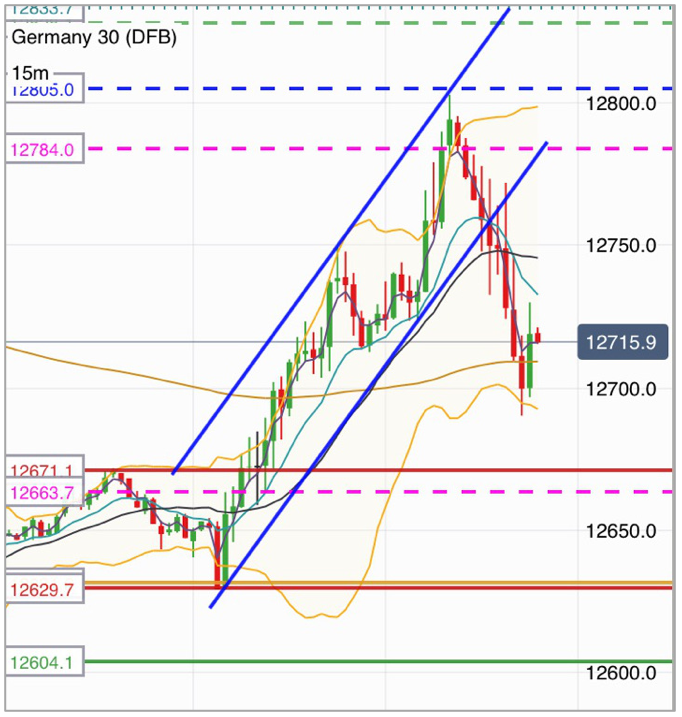
Examples of waves and channels on the 1m chart
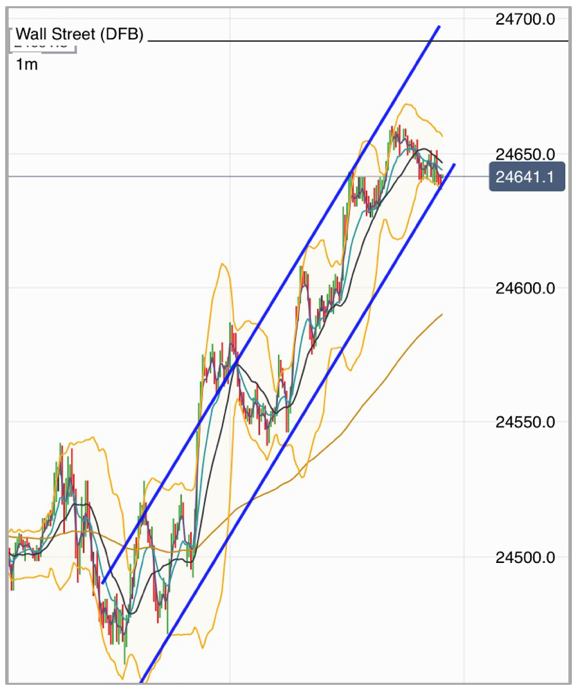
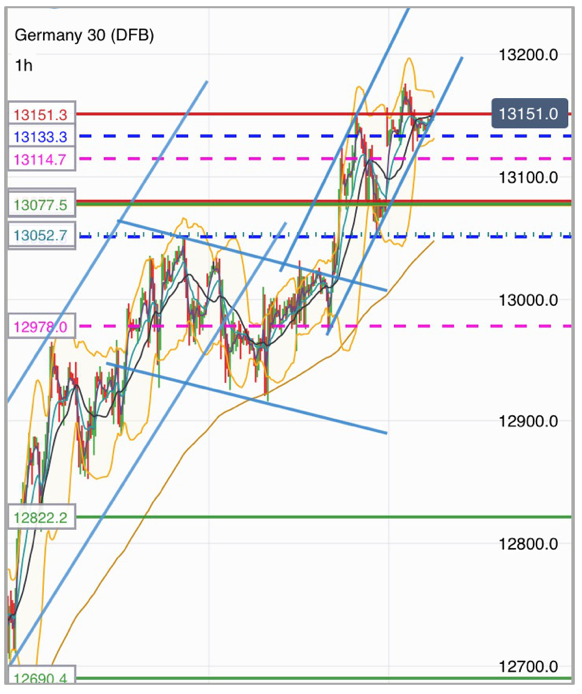
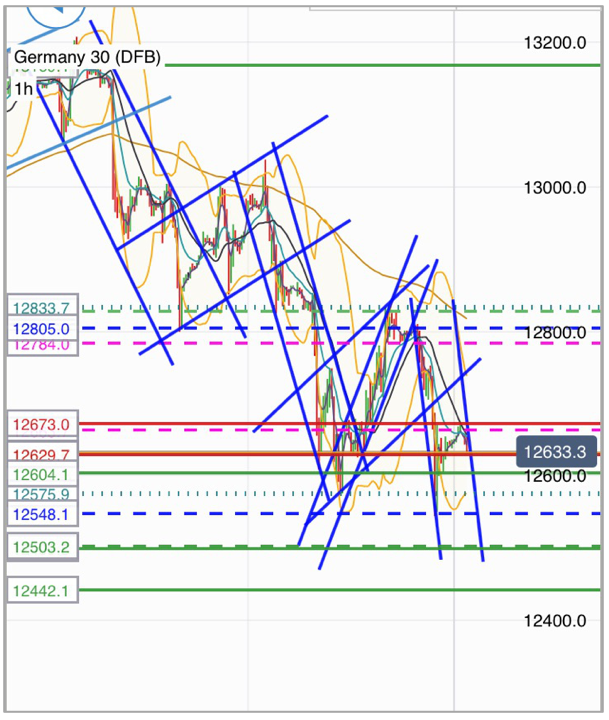
Channels and trendline trading principles
The Dax loves to move in big waves, especially in times of high ATR.
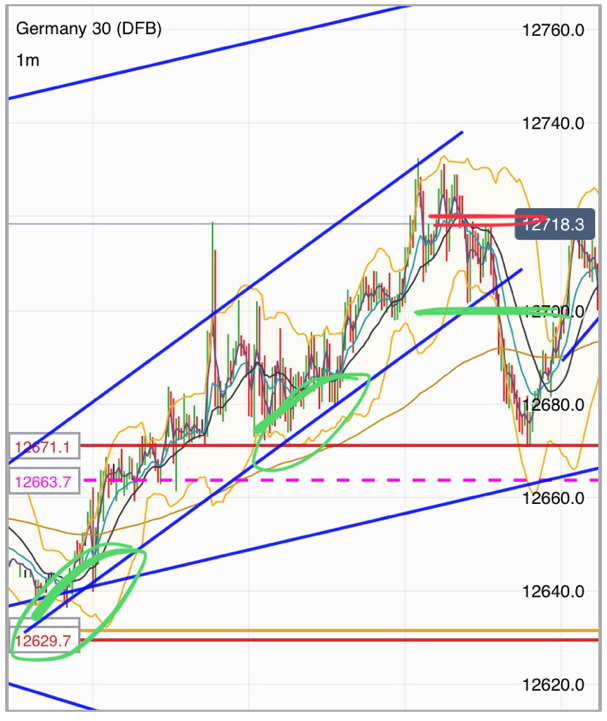
So the easiest way to trade it is to find the clear channel, and trade the breakout. Of course you won’t always spot the channel straight away because you may not have enough price action to show you, to tell you where it is.
Also, when the channels are actually forming on a higher timeframe, they can be very wide. So the best advice is to trade the narrow ones that are no-brainers.
For example:
How to find the channels
Here’s the 15m chart on euro:
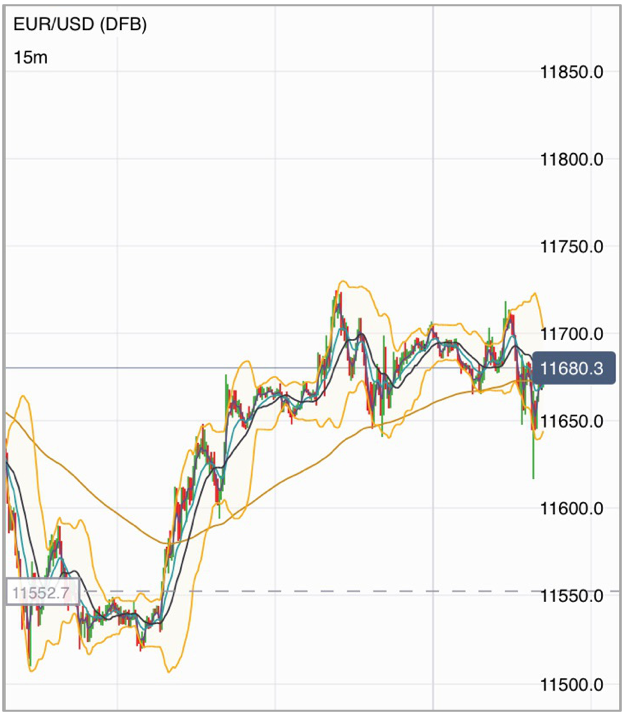
Step 1: find two or more good highs or lows.
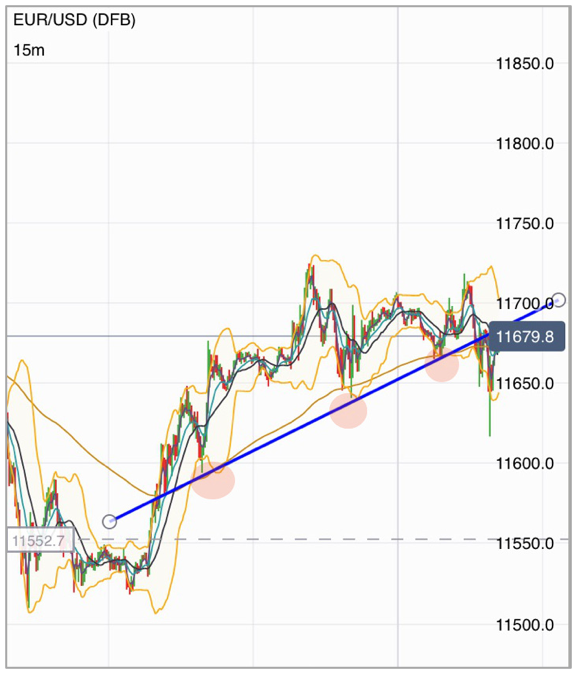
Step 2: draw the line that best fits those multiple points.
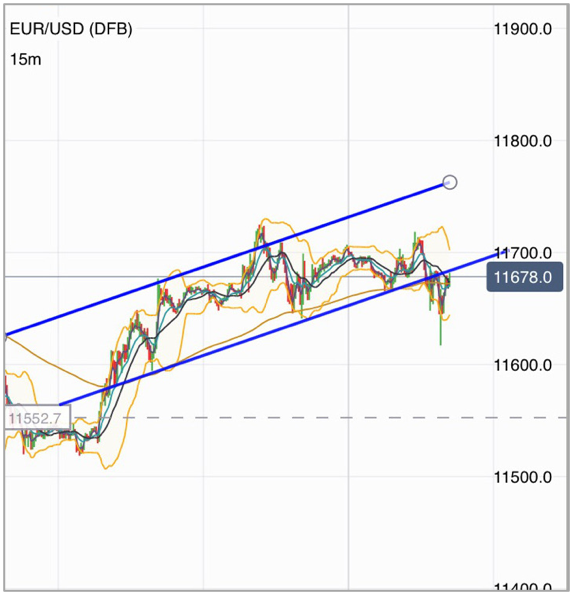
Step 3: copy the line (on IG’s new platform, right click it and choose ‘duplicate’ or ‘copy’), then drag the new line out to where it best caps prices.
On the 1h chart, when a channel is really big like this, you use the same technique on a shorter timeframe to find the smaller waves.
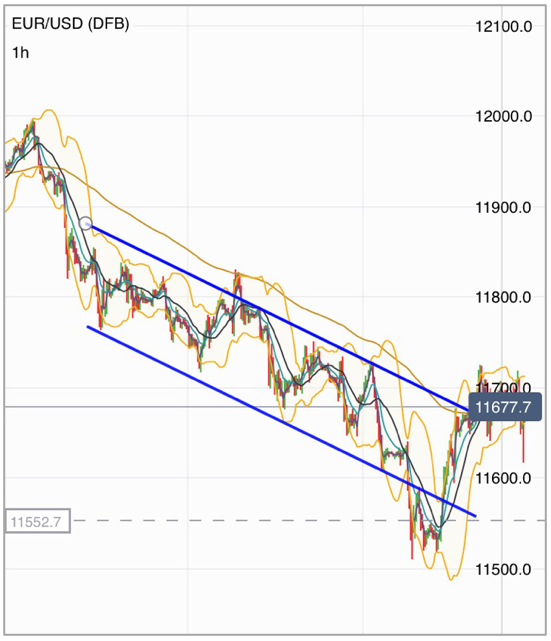
If you find a big channel that has been working a long time, rather than break outs, you can also look to trade tests of the lines. It’s best to trade in the direction of the major channel when trading the channel range.
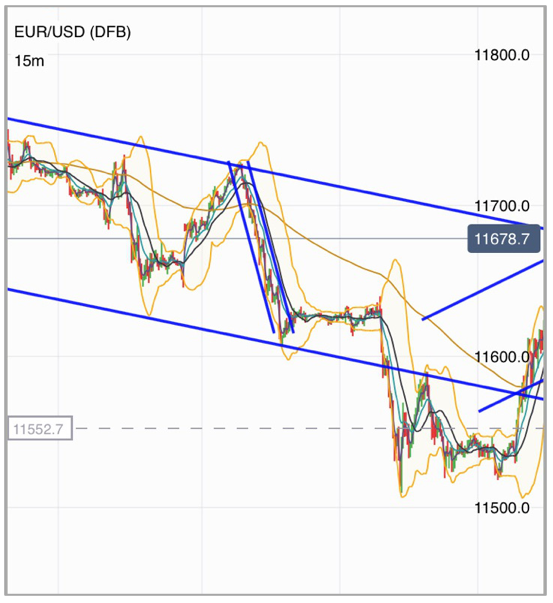
The reason why you want to trade in the direction of the major channel is that if it is slowing down, and you sell the top, your stop is above the high, and as time moves on, your stop tracks down with the trend line, reducing risk.
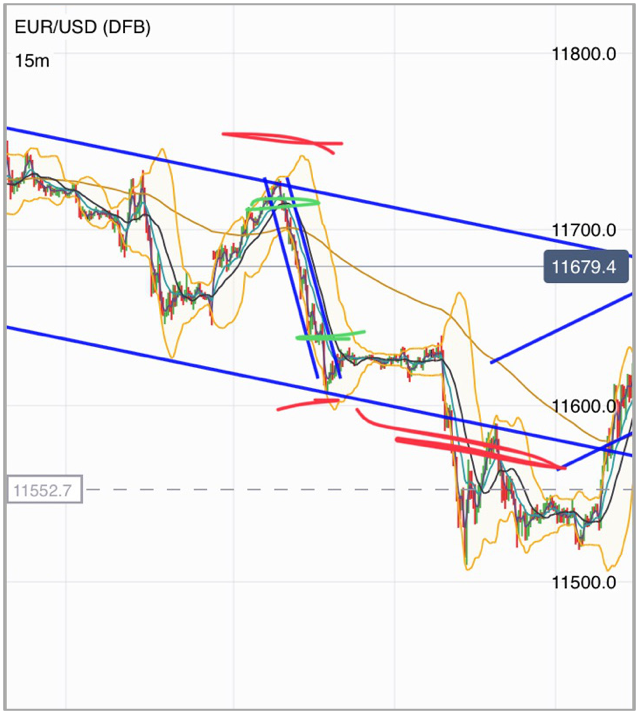
Whereas if you buy the bounce at the bottom (e.g. at the first red arrow), your stop runs away from you even though the channel is still valid. Price could slide down the lower TL for a bit before shooting up to test the top of the channel.
Trade entries and stops
When I have found a channel I like, first thing I do is identify where my risk area is — the level where price has to go to tell me I’m wrong. With a narrow channel, it’s very easy, because it’s last high or low that touched the TL.
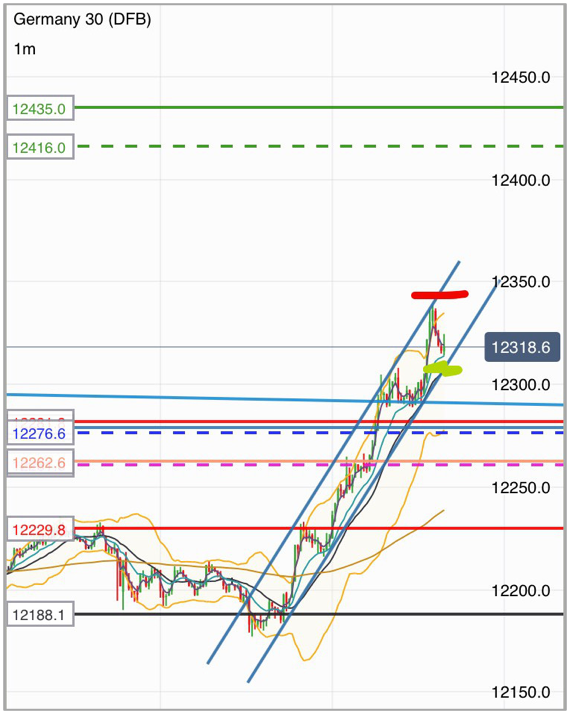
But when the channel is quite wide, that could be 30–40 pts above. So what I do then is wait for the break and retrace and use the last swing high — like the failed trade earlier.
The best place for the stop was above 25, with an entry around 700. That was too much for me, so I used the nearest lower high. Alternatively, you could just reduce size and increase your stop.
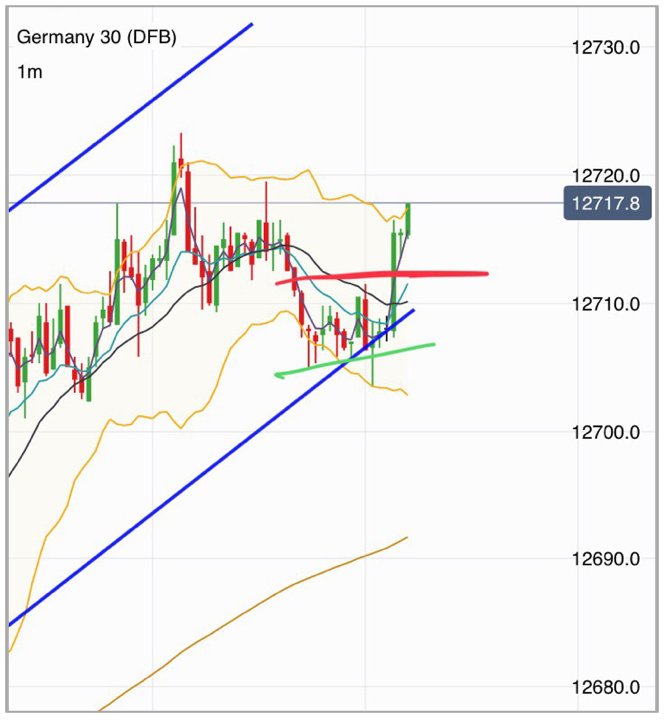
All you are doing is betting that price won’t continue in the same trend nor accelerate higher. So your stop needs to be at the level that would tell you the trend is continuing.
Now for entry, again on a narrow channel, I don’t worry about bar breaks etc. As soon as the TL breaks, I’m in — because my stop is tight above the top of the channel and that will protect me.
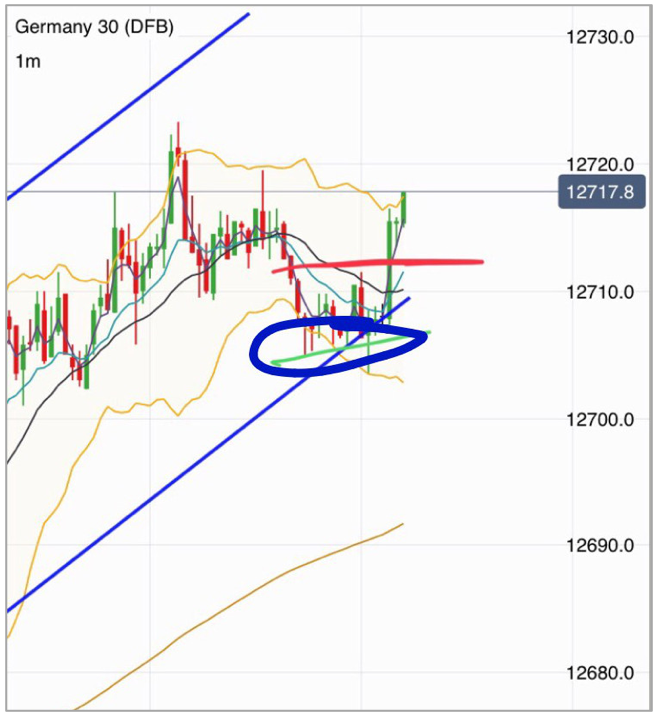
Also, on the narrow channels, the margin for error in drawing the lines is slim. On a wide channel, the error in drawing the channel magnifies, so rather than using the TL break, use the break of the last lows in the channel — the blue circle shown here:
Q&A on valid set ups, risk area and exits
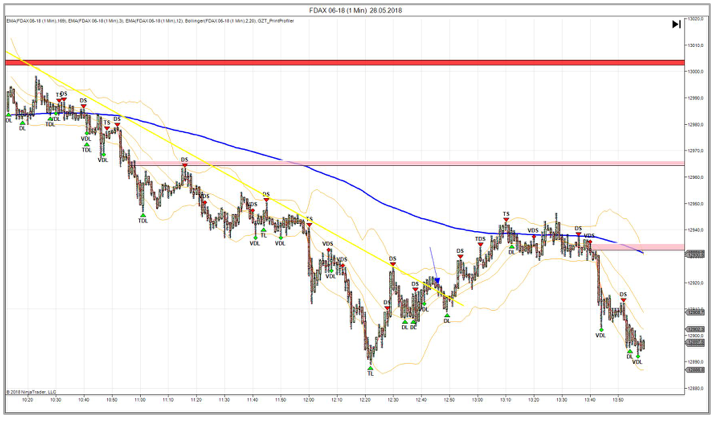
Q: What if a trendline is broken, but the stop is too big, so I wait for a retrace and then price goes back in the channel again (blue arrow on the chart below)?. Is the trade still valid?
A: Ok good question
If the price goes back into the channel, they only way to know if it’s still valid is if the price comes out the other side.
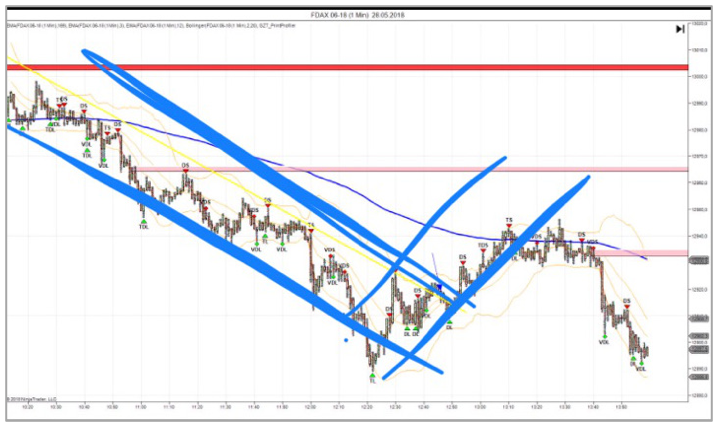
Q: But on my pic, price goes into the channel again, so it’s perfect because my stop is smaller. Would you take or pass?
A: On the higher timeframe, the trend still changed and your idea was right, but the entry was tricky — nothing is ever flawless
In those situations, calculate what your risk is and see if you are willing to find out. Look at the last channel we traded in the room, it broke the line down, then went back, then came out and retested:
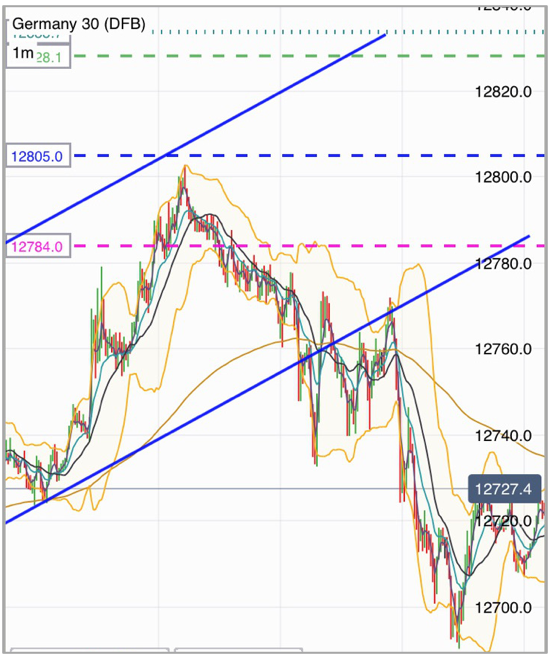
Even though price went back into the channel, the break did highlight the trend change.
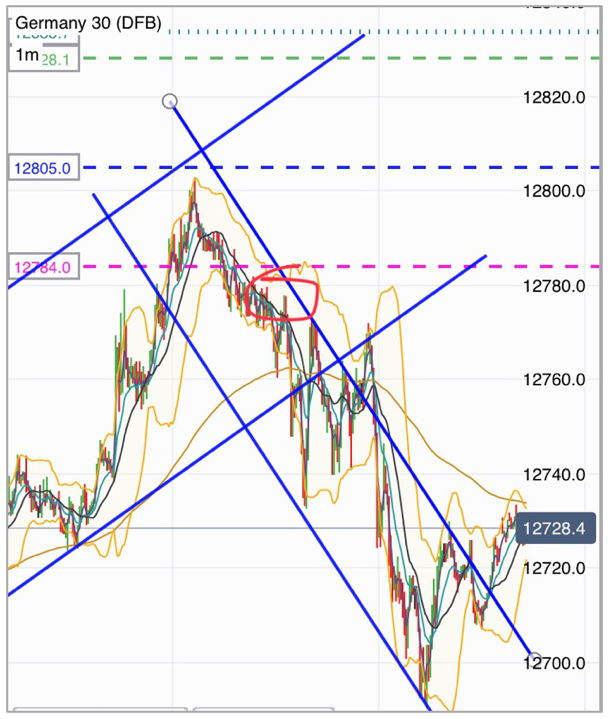
What you actually have at this point is another channel working down. The wider the channel, the less the likelihood of a clean fast plummet out of it.
So best thing to do in this case is what I did in the room: identify your risk area (circled in red above), then wait for the market to come into your play zone.
I said “look to short 770, with a stop at 780”. Then if the market comes to us — brilliant — we get a low risk entry, and if we miss it, we wait for the next setup. That 10pt risk delivered 70pts
Q: Can you explain why 780 was the risk area?
A: The last lower high was at 780. If price went above there, there was a risk that the trend could continue higher back to the top of the channel again. From the orange circle in the chart below, price had been making lower highs since then and therefore trending down. If it then made a higher high above 780, that tells me I was too early with my short and it may want to go higher first
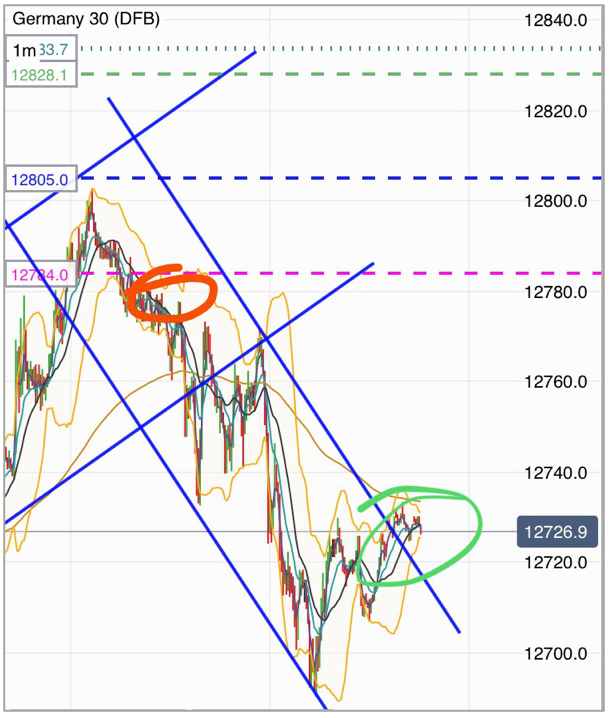
All we do when we trade is to try and spot a change in price behaviour, and put a tight trade around it.
Is it compressing then all of a sudden expanding? Is it trending one way then all of a sudden changing direction?
We need to evaluate what price is generally doing, then decide how you will know when that changes — then when it changes, can you see a low risk, high reward trade?
Q: How do you work out the exit?
A: That’s another tough one — it depends on your risk profile. Swing traders would run it till they hit a target, or see another trend change. Personally, I like to take risk out with the first drop and run it with stop to entry
Further research
There is loads of great stuff on google about price channels and trend lines and lots of webinars on Youtube too.
Do some research and then you will be able to tailor and filter trades to your own style. Nick for example, waits for the channel to break, then enters when price back tests the break out. He may miss the ones that just plummet by using the strategy, but it works for him in the long run
Similar to channels, is the Andrews pitchfork. That is how I got started with them, then refined it all to suit my needs
That’s the other thing you guys need to do: you need to evaluate a strategy over a run of say 10 trades and then work out what you can tweak and improve. Also, get into the habit of taking screenshots of your trades for review later.Trading Channels and Trendlines
Introduction — why do we draw them?
First of all, we all know that price moves in clear waves. The easiest way to trade with the lowest risk is to spot that change of direction and put a setup around it.
You can all trade price action shown in the picture below: watch a clear wave, and as soon as it turns, stick an entry in counter trend, with a stop just above the high/below the low.
Thing is, we rarely see such clean PA. Normally it looks a bit more like this: you have a clear trending move (highlighted green) followed by consolidation (in red), then another trending move.
Now when you are in the red zone, it’s very tricky to spot the turns. But what if I do this?
Consolidation is just a wave on a different time frame — look at this 1h chart:
It’s very easy to see the clear wave and the turn on the 1h — but all day, we sat and watched this:
Very hard to spot what’s actually playing out, but when you throw the channel lines on, then you spot it and it’s all very clear all of a sudden.
Examples of waves and channels on the 1m chart
m
Channels and trendline trading principles
The Dax loves to move in big waves, especially in times of high ATR.
So the easiest way to trade it is to find the clear channel, and trade the breakout. Of course you won’t always spot the channel straight away because you may not have enough price action to show you, to tell you where it is.
Also, when the channels are actually forming on a higher timeframe, they can be very wide. So the best advice is to trade the narrow ones that are no-brainers.
For example:
How to find the channels
Here’s the 15m chart on euro:
Step 1: find two or more good highs or lows.
Step 2: draw the line that best fits those multiple points.
Step 3: copy the line (on IG’s new platform, right click it and choose ‘duplicate’ or ‘copy’), then drag the new line out to where it best caps prices.
On the 1h chart, when a channel is really big like this, you use the same technique on a shorter timeframe to find the smaller waves.
If you find a big channel that has been working a long time, rather than break outs, you can also look to trade tests of the lines. It’s best to trade in the direction of the major channel when trading the channel range.
The reason why you want to trade in the direction of the major channel is that if it is slowing down, and you sell the top, your stop is above the high, and as time moves on, your stop tracks down with the trend line, reducing risk.
Whereas if you buy the bounce at the bottom (e.g. at the first red arrow), your stop runs away from you even though the channel is still valid. Price could slide down the lower TL for a bit before shooting up to test the top of the channel.
Trade entries and stops
When I have found a channel I like, first thing I do is identify where my risk area is — the level where price has to go to tell me I’m wrong. With a narrow channel, it’s very easy, because it’s last high or low that touched the TL.
But when the channel is quite wide, that could be 30–40 pts above. So what I do then is wait for the break and retrace and use the last swing high — like the failed trade earlier.
The best place for the stop was above 25, with an entry around 700. That was too much for me, so I used the nearest lower high. Alternatively, you could just reduce size and increase your stop.
All you are doing is betting that price won’t continue in the same trend nor accelerate higher. So your stop needs to be at the level that would tell you the trend is continuing.
Now for entry, again on a narrow channel, I don’t worry about bar breaks etc. As soon as the TL breaks, I’m in — because my stop is tight above the top of the channel and that will protect me.
Also, on the narrow channels, the margin for error in drawing the lines is slim. On a wide channel, the error in drawing the channel magnifies, so rather than using the TL break, use the break of the last lows in the channel — the blue circle shown here:
Q&A on valid set ups, risk area and exits
Q: What if a trendline is broken, but the stop is too big, so I wait for a retrace and then price goes back in the channel again (blue arrow on the chart below)?. Is the trade still valid?
A: Ok good question
If the price goes back into the channel, they only way to know if it’s still valid is if the price comes out the other side
Q: But on my pic, price goes into the channel again, so it’s perfect because my stop is smaller. Would you take or pass?
A: On the higher timeframe, the trend still changed and your idea was right, but the entry was tricky — nothing is ever flawless
In those situations, calculate what your risk is and see if you are willing to find out. Look at the last channel we traded in the room, it broke the line down, then went back, then came out and retested:
Even though price went back into the channel, the break did highlight the trend change.
What you actually have at this point is another channel working down. The wider the channel, the less the likelihood of a clean fast plummet out of it.
So best thing to do in this case is what I did in the room: identify your risk area (circled in red above), then wait for the market to come into your play zone.
I said “look to short 770, with a stop at 780”. Then if the market comes to us — brilliant — we get a low risk entry, and if we miss it, we wait for the next setup. That 10pt risk delivered 70pts
Q: Can you explain why 780 was the risk area?
A: The last lower high was at 780. If price went above there, there was a risk that the trend could continue higher back to the top of the channel again. From the orange circle in the chart below, price had been making lower highs since then and therefore trending down. If it then made a higher high above 780, that tells me I was too early with my short and it may want to go higher first
All we do when we trade is to try and spot a change in price behaviour, and put a tight trade around it.
Is it compressing then all of a sudden expanding? Is it trending one way then all of a sudden changing direction?
We need to evaluate what price is generally doing, then decide how you will know when that changes — then when it changes, can you see a low risk, high reward trade?
Q: How do you work out the exit?
A: That’s another tough one — it depends on your risk profile. Swing traders would run it till they hit a target, or see another trend change. Personally, I like to take risk out with the first drop and run it with stop to entry
Further research
There is loads of great stuff on google about price channels and trend lines and lots of webinars on Youtube too.
Do some research and then you will be able to tailor and filter trades to your own style. Nick for example, waits for the channel to break, then enters when price back tests the break out. He may miss the ones that just plummet by using the strategy, but it works for him in the long run
Similar to channels, is the Andrews pitchfork. That is how I got started with them, then refined it all to suit my needs
That’s the other thing you guys need to do: you need to evaluate a strategy over a run of say 10 trades and then work out what you can tweak and improve. Also, get into the habit of taking screenshots of your trades for review later.

